
Running a profitable claw machine business requires more than choosing attractive prizes and placing machines in busy locations. Arcade owners and family entertainment center (FEC) operators need reliable data to understand how their equipment performs.
How many paid plays does each machine generate? How often do customers win prizes? What percentage of revenue goes toward prize costs? And which machines generate the strongest financial contribution after operating expenses?
These questions can be answered by tracking claw machine KPIs (key performance indicators).
A well-organized KPI system helps operators evaluate revenue, control costs, identify maintenance problems, and make better decisions about pricing, merchandise, and machine placement.
This guide explains the most important claw machine performance metrics, how to calculate them, and how to use operational data to improve the performance of commercial prize machines.
1. Why Claw Machine KPIs Matter
Claw machines generate revenue through individual games, but revenue alone does not reveal whether a machine is performing well.
A machine may attract many customers yet produce disappointing financial results because its prizes are expensive. Another may have a lower play count but deliver a stronger contribution because of its merchandise mix and operating costs.
Without consistent data, operators may make decisions based on impressions rather than actual performance.
Tracking KPIs allows businesses to:
- Measure daily, weekly, and monthly paid plays.
- Understand revenue generated by individual machines.
- Monitor prize distribution and merchandise expenses.
- Identify differences between expected and actual collections.
- Compare machines across locations.
- Measure downtime and maintenance requirements.
- Evaluate the financial impact of operational improvements.
- Plan equipment upgrades and future investments.
According to IAAPA's guidance on arcade revenue operations, prizes, equipment maintenance, and ongoing reinvestment are important considerations for arcade operators.
The goal of KPI tracking is not simply to maximize every individual metric. It is to understand how different metrics work together to support sustainable performance.
2. The 10 Claw Machine KPIs Every Operator Should Track
A useful claw machine performance dashboard should combine activity, revenue, prize costs, reliability, and financial results.
The following ten indicators provide a practical starting point.
| KPI | Calculation | What it measures |
|---|---|---|
| Paid Plays | Count of completed paid games | Customer purchasing activity |
| Play Revenue | Revenue attributable to games played | Total game sales |
| Revenue per Paid Play | Play Revenue ÷ Paid Plays | Average revenue per paid game |
| Observed Win Rate | Prizes Won ÷ Total Completed Plays × 100% | Frequency of actual prize wins |
| Prize Cost Payout | Cost of Prizes Awarded ÷ Play Revenue × 100% | Share of revenue spent on prizes |
| Average Prize Cost | Total Cost of Prizes Awarded ÷ Prizes Won | Average acquisition cost of each prize |
| Contribution Margin | Machine Contribution ÷ Play Revenue × 100% | Profitability after defined direct expenses |
| Machine Uptime | Available Hours ÷ Scheduled Hours × 100% | Equipment availability |
| Revenue per Scheduled Hour | Play Revenue ÷ Scheduled Hours | Revenue efficiency over the full schedule |
| Collection Variance | Actual Collections − Expected Collections | Differences requiring reconciliation |
Operators should also record complimentary games, refunds, service tests, and promotional credits separately.
These activities may affect prize distribution without generating the same revenue as normal paid plays.
Not every claw machine provides every counter or report. The available information depends on the controller, payment hardware, and any connected management system.
3. How to Track Paid Plays and Revenue
Understand the Difference Between Paid and Total Plays
Paid plays represent games purchased by customers.
Total completed plays include both paid games and complimentary games, such as authorized promotional or service plays.
For example:
- Paid plays: 1,600
- Complimentary plays: 40
- Total completed plays: 1,640
This distinction matters because complimentary games may distribute prizes even though they generate no direct revenue.
If an operator divides revenue by all games instead of paid games, the resulting revenue-per-play figure may understate the average value of a purchased game.
Calculate Revenue per Paid Play
The formula is:
Revenue per Paid Play = Play Revenue ÷ Paid Plays
Suppose a machine generates $2,400 from 1,600 paid games.
Revenue per Paid Play = $2,400 ÷ 1,600 = $1.50
This figure is useful when a venue offers discounted packages, different credit prices, or promotions.
For machines connected to prepaid cards or wallets, operators should use a consistent accounting method to attribute revenue to completed plays. Money loaded onto a card is not necessarily equivalent to revenue earned by a particular machine during the same period.
Track Cash and Cashless Payments
A commercial claw machine may accept coins, tokens, cards, QR codes, or other compatible payment methods.
Keep separate records for payment channels when possible.
For cash-operated machines, compare cash collected with the machine's recorded payments and credits. For cashless systems, compare payment-provider records with the machine's game data.
The IRS guidance on recording business transactions emphasizes maintaining accurate records and supporting documentation for business income and expenses.
Operators should also record refunds, prepaid-credit adjustments, and known meter errors to avoid misinterpreting collection differences.
4. Win Rate vs. Prize Cost Payout: Understanding the Difference
One of the most common mistakes in claw machine analysis is treating winning frequency and prize cost payout as the same metric.
They measure different things.
What Is Claw Machine Win Rate?
Observed win rate shows how often completed games result in a recorded prize win.
Win Rate = Confirmed Prize Wins ÷ Total Completed Plays × 100%
Suppose a machine records 123 prize wins during 1,640 completed games.
Win Rate = 123 ÷ 1,640 × 100% = 7.5%
In this example, approximately 7.5% of completed games resulted in a recorded prize win.
This is an observed historical result, not necessarily a guaranteed winning probability for future games.
Claw mechanism condition, prize characteristics, player interaction, game configuration, and applicable regulatory requirements may all affect the outcome.
What Is Prize Cost Payout?
Prize cost payout measures how much of the machine's play revenue is consumed by the acquisition cost of prizes awarded.
Prize Cost Payout = Cost of Prizes Awarded ÷ Play Revenue × 100%
If 123 prizes have an average acquisition cost of $3 each, their total cost is $369.
With play revenue of $2,400:
Prize Cost Payout = $369 ÷ $2,400 × 100% = 15.4%
The machine distributes prizes in 7.5% of games, while the prize merchandise represents approximately 15.4% of revenue.
These figures should not be confused.
Why the Term "Payout" Can Be Confusing
Different arcade machines and management systems may use the word payout in different ways.
Some use it to describe the number or frequency of prizes awarded. Others express the merchandise cost as a percentage of revenue.
For example, the E-Claw operator documentation describes income, product value, win counters, and a payout percentage within its accounting functions.
Always check the machine manual before interpreting a payout figure.
Practical recommendation: In your operating reports, label the two metrics separately as "Observed Win Rate" and "Prize Cost Payout %" to avoid confusion.
5. How to Calculate Claw Machine Profit and Unit Economics
Revenue is only the beginning of a profitability calculation.
Operators must also understand the cost of awarding prizes and maintaining each machine.
Calculate Prize Cost per Paid Play
Prize Cost per Paid Play = Total Prize Cost ÷ Paid Plays
Using the previous example:
$369 ÷ 1,600 = approximately $0.23 per paid play
This metric allocates all prizes awarded during the period, including those from complimentary games, across revenue-generating games.
It therefore connects merchandise spending directly to paid game activity.
Calculate Revenue After Prize Costs
A simple starting point is:
Revenue After Prize Costs = Play Revenue − Cost of Prizes Awarded
For example:
$2,400 − $369 = $2,031
The corresponding margin is:
$2,031 ÷ $2,400 × 100% = 84.6%
However, this is not the machine's final operating profit.
It excludes other expenses associated with running the equipment.
Calculate Machine Contribution
For internal operating decisions, define machine contribution as:
Machine Contribution = Play Revenue − Prize Costs − Direct Operating Expenses
Relevant expenses may include:
- Location rent or revenue-sharing payments
- Payment processing charges
- Equipment repairs and spare parts
- Directly allocated staff costs
- Electricity and routine cleaning expenses
Other business costs, such as administration, financing, depreciation, and taxes, may be excluded from this operating measure. Businesses should apply their accounting policies consistently.
Understand Investment Payback and ROI
When evaluating a new machine, operators can compare the initial investment with the additional cash contribution expected from the equipment.
Simple Payback Period = Initial Investment ÷ Average Periodic Net Cash Inflow
This is a simplified investment measure, not a guaranteed repayment period.
A full return-on-investment analysis should consider shipping, installation, working capital, equipment lifespan, ongoing maintenance, taxes, and other relevant cash flows.
6. Monthly Claw Machine KPI Example
Consider a hypothetical commercial claw machine operating in a family entertainment center.
The following figures are illustrative and do not represent actual EPARK customer results or expected market performance.
Monthly Operating Data
| Metric | Monthly result |
|---|---|
| Paid plays | 1,600 |
| Complimentary plays | 40 |
| Total completed plays | 1,640 |
| Play revenue | $2,400 |
| Confirmed prize wins | 123 |
| Average prize acquisition cost | $3.00 |
| Total cost of prizes awarded | $369 |
| Scheduled operating hours | 300 |
| Downtime | 12 hours |
| Available operating hours | 288 |
Calculated Performance KPIs
| KPI | Calculation | Result |
|---|---|---|
| Revenue per Paid Play | $2,400 ÷ 1,600 | $1.50 |
| Observed Win Rate | 123 ÷ 1,640 | 7.5% |
| Prize Cost Payout | $369 ÷ $2,400 | 15.4% |
| Prize Cost per Paid Play | $369 ÷ 1,600 | $0.23 |
| Revenue After Prize Costs | $2,400 − $369 | $2,031 |
| Margin After Prize Costs | $2,031 ÷ $2,400 | 84.6% |
| Uptime | 288 ÷ 300 | 96.0% |
| Revenue per Scheduled Hour | $2,400 ÷ 300 | $8.00 |
| Revenue per Available Hour | $2,400 ÷ 288 | $8.33 |
Adding Operating Expenses
| Expense | Monthly amount |
|---|---|
| Prizes awarded | $369 |
| Location fee | $480 |
| Payment processing | $60 |
| Maintenance and repairs | $110 |
| Allocated direct labor | $200 |
| Electricity | $36 |
| Total defined direct expenses | $1,255 |
The machine's monthly contribution is:
$2,400 − $1,255 = $1,145
Its contribution margin is:
$1,145 ÷ $2,400 × 100% = 47.7%
This figure is the contribution under the stated cost assumptions, not the business's final net profit.
What These Numbers Tell the Operator
This machine generated revenue consistently, but several questions remain:
- Could the 12 hours of downtime have been prevented?
- Are the prizes attractive enough to support repeat plays?
- Does the observed win rate reflect reliable operation and an acceptable player experience?
- Is the location fee justified by customer traffic?
- Would an alternative prize mix improve demand without making costs excessive?
Good KPI analysis leads to specific questions and controlled improvements—not automatic changes based on a single percentage.
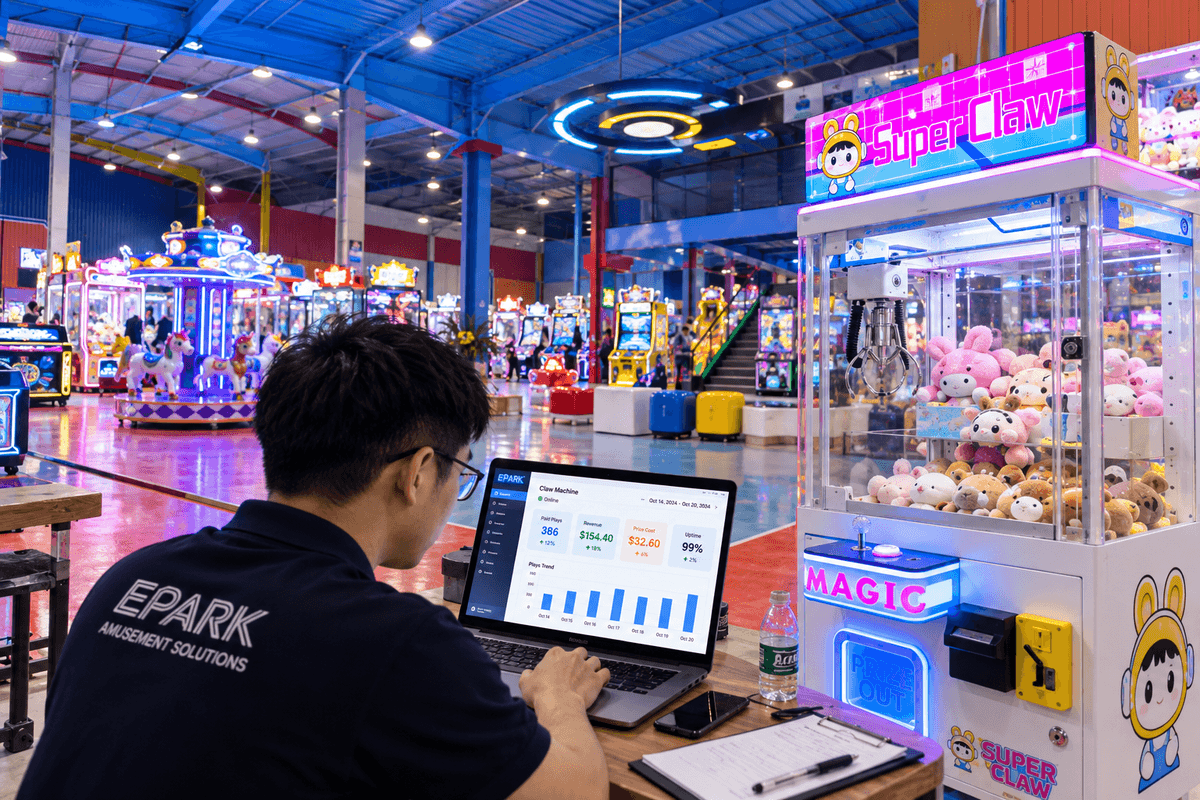
7. How to Build a Claw Machine KPI Dashboard
Operators do not necessarily need expensive software to begin tracking performance.
For a small number of machines, a structured spreadsheet may be sufficient.
Larger operations may benefit from connected payment reports, machine accounting systems, or management software when supported by the equipment.
Recommended Data Fields
A simple spreadsheet can include:
| Field | Example |
|---|---|
| Date or reporting period | October 2026 |
| Venue | Shopping Mall A |
| Machine ID | CM-001 |
| Paid plays | 1,600 |
| Complimentary plays | 40 |
| Play revenue | $2,400 |
| Confirmed prize wins | 123 |
| Prize costs | $369 |
| Downtime hours | 12 |
| Direct operating expenses excluding prizes | $886 |
| Operating notes | Payment module checked |
This example follows the monthly scenario above. Figures are illustrative.
Use a Consistent Reporting Period
Daily reports help staff identify sudden problems.
Weekly reports show short-term trends and help evaluate operational changes.
Monthly reports are more suitable for comparing overall performance, cost ratios, and investment decisions.
Make sure all machines use the same reporting period when comparing results.
Reconcile the Physical Prize Inventory
Prize sensors do not always capture every relevant event correctly.
An inventory reconciliation can be expressed as:
Expected Ending Inventory = Opening Inventory + Prizes Added − Confirmed Prizes Dispensed − Other Documented Removals
Compare the expected inventory with the actual stock remaining in the machine.
Document damaged stock, manually awarded prizes, removed merchandise, and other adjustments separately.
A difference may indicate a recording error, incorrect refilling records, equipment malfunction, or another issue requiring investigation.
Keep Meter Definitions Consistent
Some controllers have separate lifetime and period counters.
Others may distinguish coin inputs, games played, prizes awarded, and complimentary games.
For example, the E-Claw manual documents accounting and cashbox functions, including game counts, win counts, money received, and prize refills.
Before creating a dashboard, confirm which values your machines provide and whether they represent events, credits, or monetary amounts.
8. How to Identify Performance Problems Through Data
A KPI dashboard becomes valuable when operators use it to investigate changes in performance.
High Plays but Low Contribution
Possible causes include expensive merchandise, frequent prize awards, high venue-sharing expenses, or excessive operating costs.
Review prize acquisition costs and the complete expense structure rather than assuming a busy machine must be profitable.
Low Plays but Normal Prize Costs
The machine may suffer from poor visibility, weak prize appeal, unsuitable pricing, or unfavorable placement.
Compare performance with similar machines in comparable locations and time periods.
Changing machine settings will not necessarily solve a demand problem.
Unusual Changes in Win Rate
A sudden change may indicate a prize mix change, damaged claw components, incorrect settings, or errors in prize detection.
Investigate the cause before making adjustments.
High Downtime
Repeated faults can reduce revenue and customer satisfaction.
Track the duration and reason for every interruption, including payment failures, claw movement problems, prize jams, and scheduled servicing.
Where possible, distinguish planned maintenance from unplanned downtime.
Cash Collection Discrepancies
A difference between expected and actual collections should be investigated through payment reports, cash counts, refunds, meter logs, and authorized adjustments.
Do not assume every variance represents theft or fraud.
Establish a documented reconciliation procedure and restrict access to cash and sensitive settings.
9. How to Improve Claw Machine Performance Responsibly
Improving machine performance is not only about increasing play prices or reducing prize costs.
Operators should balance sustainable revenue with customer experience, equipment reliability, and applicable local rules.
Improve Prize Selection
Select merchandise based on customer interests, prize quality, acquisition cost, and compatibility with the claw mechanism.
Test different prize themes while recording the dates and costs of each change.
Review Machine Placement
A machine placed near an active family entertainment area may perform differently from one installed in a low-visibility corner.
Compare customer traffic, scheduled hours, plays, and revenue before and after relocation.
Maintain Mechanical Reliability
Inspect claw assemblies, payment systems, controls, and prize detection components regularly.
Incorrect mechanical operation may distort win-rate data and create a poor customer experience.
Use Fair and Transparent Game Settings
Some commercial claw machines include configurable game parameters. Their availability and legal use depend on the specific model and local regulations.
Settings and prize representations should comply with applicable consumer protection and amusement rules.
Operators should not advertise a particular winning probability without a reasonable basis or mislead customers about how the game works.
The U.S. Federal Trade Commission's guidance on truthful prize-related claims illustrates the broader importance of accurate representations about prize opportunities.
Change One Variable at a Time
When testing improvements, avoid changing price, prize type, machine placement, and game configuration simultaneously.
Instead, document a clear change, compare a reasonable period before and after implementation, and consider seasonal traffic and other external factors.
This produces more useful evidence about what actually improved performance.
10. A Manufacturer's Perspective on Claw Machine Performance
Claw machine KPI analysis should begin before equipment is purchased.
Different machine models may support different game counters, payment methods, service menus, and diagnostic functions.
What Operators Should Ask Before Buying
When comparing suppliers, ask:
- Does the machine record paid plays and total games separately?
- Can operators view prize win counts and accounting information?
- Are complimentary games identifiable?
- Which payment methods are supported?
- Is there a procedure for verifying prize sensor accuracy?
- Can service staff access diagnostic and fault information?
- Can data be exported or connected to external software, if required?
- What technical documentation and after-sales support are available?
Do not assume every commercial claw machine includes cloud analytics, remote monitoring, or automated reports.
Request confirmation for the exact model and controller version.
How EPARK Supports Commercial Claw Machine Projects
Guangzhou EPARK Electronic Technology Co., Ltd. is a Guangzhou-based commercial arcade equipment manufacturer with more than 13 years of industry experience and over 25,000 square meters of factory and showroom space.
EPARK offers commercial claw machines, prize machines, OEM/ODM customization, venue planning, 3D design services, equipment configuration, and after-sales technical support.
For buyers planning a new arcade or FEC, EPARK can help discuss equipment selection, available payment configurations, space planning, and maintenance considerations.
Before ordering, buyers should confirm the specific machine's accounting features, available settings, payment compatibility, and technical documentation.
Explore EPARK's claw machine selection to compare equipment options for your venue.
11. Frequently Asked Questions
What are the most important claw machine KPIs?
The most useful indicators include paid plays, play revenue, revenue per paid play, observed win rate, prize cost payout, machine contribution, uptime, and collection variance. Together, they help operators evaluate activity, cost, reliability, and financial performance.
How do you calculate the win rate of a claw machine?
Divide confirmed prize wins by total completed games, then multiply by 100. For example, 80 wins from 1,000 completed games represents an 8% observed win rate.
What is the difference between win rate and payout percentage?
Win rate measures how frequently players receive prizes. Prize cost payout measures the value of awarded merchandise as a percentage of revenue. Some machine controllers use different payout definitions, so operators should verify the terminology.
How do you calculate prize cost per play?
Divide the total acquisition cost of prizes awarded during the period by the number of paid games. Be consistent about how complimentary games and their associated prize expenses are treated.
How often should operators review claw machine performance?
Daily checks are useful for detecting sudden changes, weekly reviews help identify short-term trends, and monthly reports support cost and investment decisions. The reporting frequency should reflect the size and complexity of the operation.
Can a high-revenue claw machine still be unprofitable?
Yes. High prize costs, rent, revenue-sharing agreements, payment fees, maintenance, and labor expenses can reduce or eliminate the machine's financial contribution.
Do claw machines have built-in KPI tracking?
Some models include counters for income, games, and prizes. More advanced models may support additional reporting or remote management. Features vary by manufacturer and model, so buyers should confirm what is available.
How can operators improve claw machine profitability?
Begin by analyzing prize costs, player demand, machine placement, downtime, and direct operating expenses. Make controlled improvements and compare results over consistent periods rather than relying only on revenue or changing game difficulty.
12. Conclusion: Turn Claw Machine Data into Better Business Decisions
Successful claw machine operation requires more than counting the money collected at the end of the day.
By tracking paid plays, observed win rates, prize cost payout, revenue per play, machine contribution, and downtime, operators can understand how their equipment performs and where improvements may be needed.
The most important principle is consistency. Use clearly defined metrics, reliable records, and comparable reporting periods.
A machine with high revenue is not necessarily the most profitable, and a low win rate does not automatically mean the operation is successful.
For arcade owners, FEC operators, and equipment buyers, performance data should guide prize selection, maintenance, machine placement, and long-term investment decisions.
If you are planning to expand your claw machine area or develop a new arcade project, EPARK offers commercial equipment options, customization, and project planning support.
Visit our commercial claw machine product range or contact the EPARK team to discuss your equipment requirements, available configurations, and project plans.
